
| Weather Fact: | An inch of rain water is equivalent to 15 inches of dry, powdery snow. |
ClimeMET is an interactive, intelligent weather monitoring system. It provides you with a wealth of information about the weather where you are, and combines this with learning resources for all Key Stages of the curriculum.
Forecast Charts for Europe
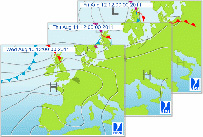
ClimeMET's forecast charts give users a visual guide to the weather over the coming 48, 72 & 96 hours. European Weather and Forecast.
The forecast charts clearly shows prevailing weather fronts across continental Europe and the UK.
The charts also depict areas of high pressure and low pressure.
Satellite Images – Visible Light
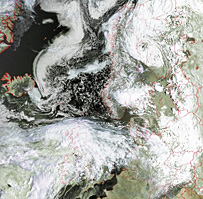
The detailed satellite images provided in the ClimeMET Data Suite display images captured by the 4 NOAA (National Oceanic & Atmospheric Administration) satellites as they circle the Earth.
Visible satellite images are literally photographs of the earth. They show clouds in the visible portion of the electromagnetic spectrum. These types of satellite maps show low clouds, fog and snow cover better than Infrared images, and can be very detailed.
Visible light images are updated between the hours of 0600 & 2200, as it is dark at night. The images are updated every hour, but satellite orbits mean that it may not actually change if there has not been a pass in more than one hour.
Infrared Satellite Images
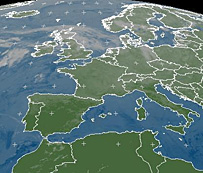
The infrared images in ClimeMET show the invisible infrared radiation emitted by clouds and land or ocean surfaces. These charts are a good start point for determining and displaying temperature variation.
Charts are presented in grey scale, and warmer temperatures appear as darker and cooler temperatures appear much lighter.
Lighter areas of cloud show where the cloud tops are cooler and therefore where weather features like fronts and shower clouds are.
Rainfall Charts
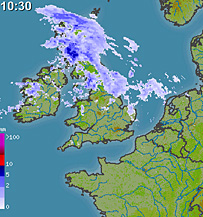
ClimeMET Weather includes an animated rainfall chart for the UK & Europe. Infrared satellite images track the movement of precipitation by sending out electromagnetic pulses and measuring how long they take to return from a target.
Combined with the radar's ability to scan up and down, and in a circle in all directions, modern radars can measure the three-dimensional distribution of precipitation within 100+ miles of the radar.