
| Weather Fact: | Baseball sized hail killed 246 people in India in 1888. |
ClimeMET is an interactive, intelligent weather monitoring system. It provides you with a wealth of information about the weather where you are, and combines this with learning resources for all Key Stages of the curriculum.
National Highs and Lows
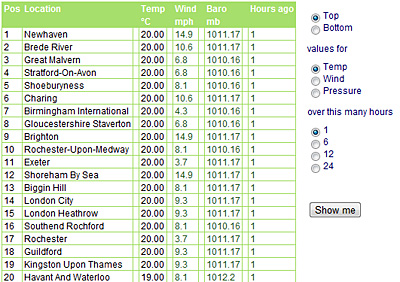
ClimeMET's High & Low Comparison Table gives users the ability to review and compare the differing weather conditions across the UK.
Users can search over a 1, 6, 12 or 24 hour period – looking at Temperature, Wind Speed and Pressure.
Raw Data
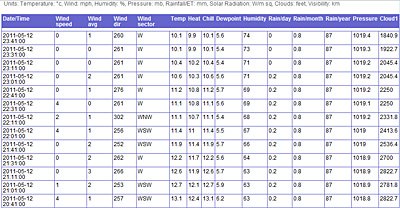
The Raw Data provision in ClimeMET provides a full breakdown of the weather intelligence recorded each hour by your weather station.
This includes standard measures like Wind Speed & Temperature, but also includes Average Wind Speed, Dew Point and Cumulative Rainfall Analysis.
Weather History
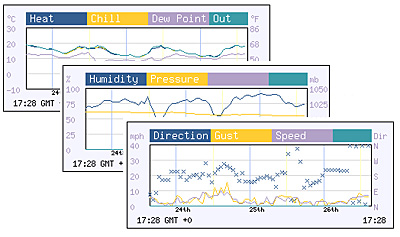
ClimeMET provides data in an interactive format which allows users to compare and review historical measurements for up to 31 days.
Each table can be viewed in large screen format for clarity.
The ClimeMET system has the capacity to store data for up to 6 months, so provided this information is available from your weather station, ClimeMET can give you a unique insight into the climate of your location.
Last 10 Days
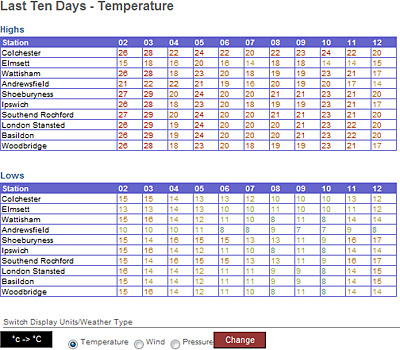
ClimeMET gives users a unique view of their local micro climate, providing High and Low records for location stations over the past 10 days.
This interactive table allows users to review Temperature, Wind Speed & Barometric Pressure.
Data Download Options
ClimeMET data can be downloaded in raw format to a .CSV file. There is a selection criterion allowing users to specify a date range, and provided the data is available, it is instantly downloaded to Excel.